Backtest Lab Docs
Evaluation Timeline
Understanding when a strategy evaluates market data and when its trading orders can be executed is essential for interpreting backtest results.
Backtest Lab follows a candle-based execution model. Strategy decisions are made using completed market data, and orders generated by those decisions can only be executed using subsequent market data.
When Does the Strategy Run?
Backtest Lab evaluates your strategy at regular intervals, determined by its execution rate.
Currently, all strategies run at an execution rate of 1 minute. Other execution rates may be introduced in the future.
At each execution step:
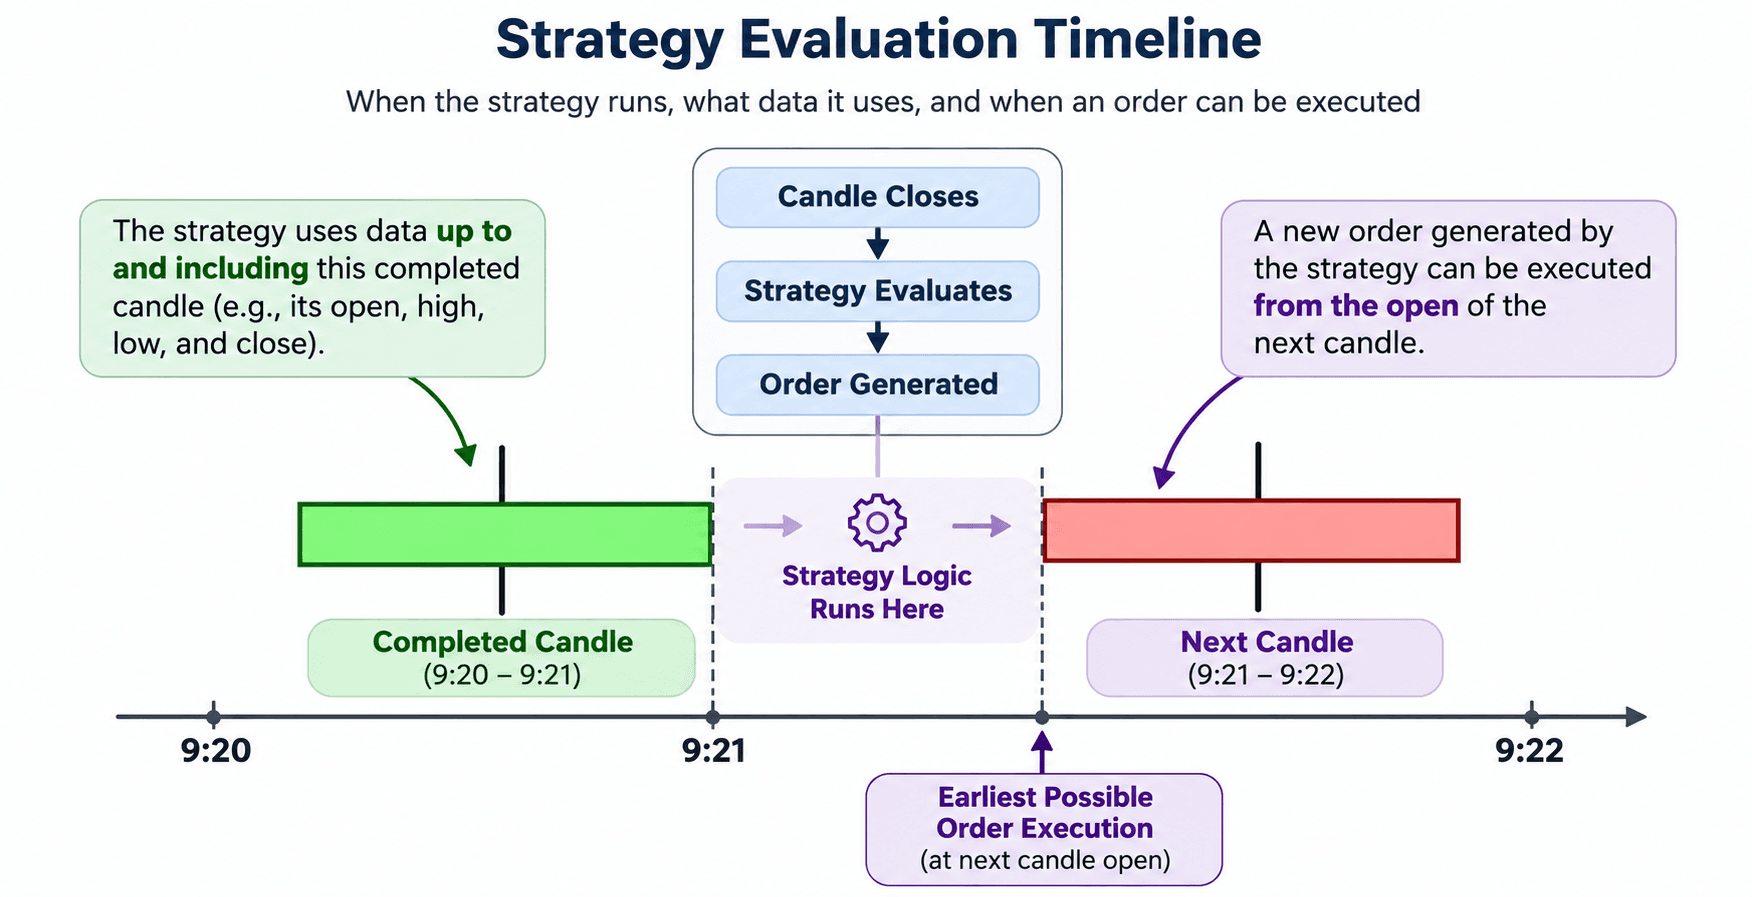
- The current 1-minute candle completes.
- The strategy evaluates its conditions using all available price history, including the candle that just completed.
- If a condition is satisfied, the strategy transitions to the connected state and performs its configured actions.
- Any orders generated by these actions become eligible for execution starting from the open of the next 1-minute candle.
For example, consider the 1-minute candle covering trading activity from 9:20 AM to 9:21 AM.
Once this candle closes at 9:21 AM, the strategy evaluates its logic using price information available up to that point.
If this evaluation generates a market buy order, the earliest possible entry is at the opening price of the next candle, which begins at 9:21 AM.
The strategy can use the close of a candle to make a decision, but it cannot use that same candle's closing price as the execution price of a newly generated market order.
Accessing Candles of Different Timeframes
Although the strategy currently runs every minute, its conditions can use candles from other timeframes, such as 5 minutes, 15 minutes, 1 hour, or 1 day.
The important rule is:
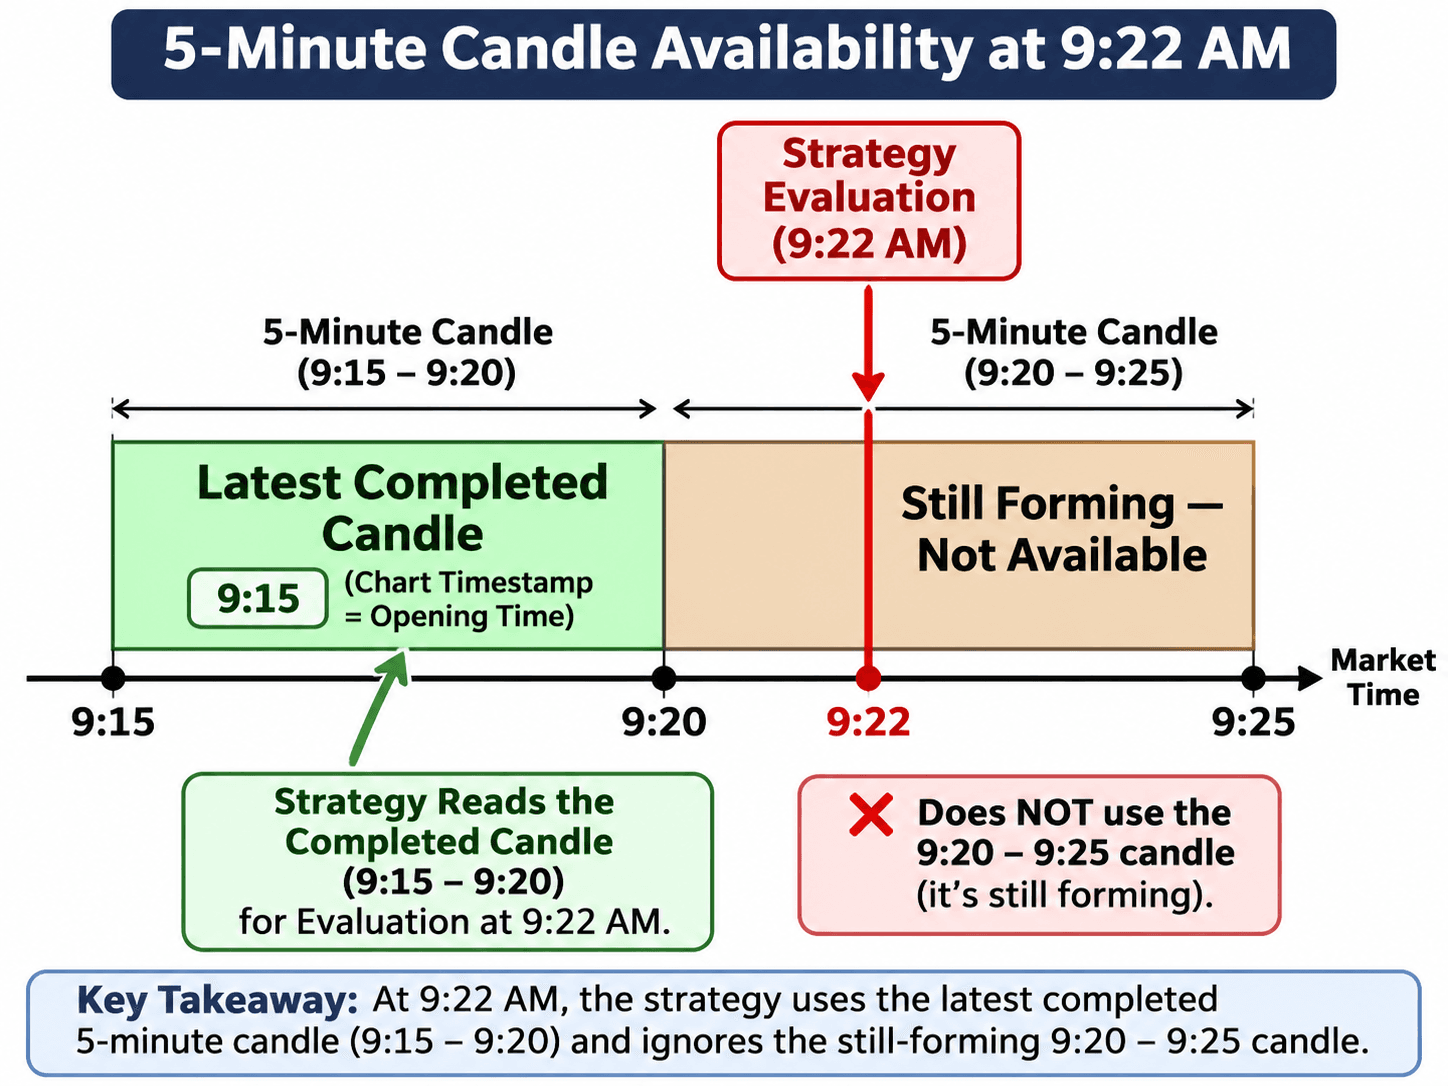
Whenever a strategy requests candle data, it receives the latest fully completed candle of the requested timeframe. A candle that is still forming is never used.
For example, suppose your strategy is being evaluated at 9:22 AM and requests the latest 5-minute candle.
The market opened at 9:15 AM, so the 5-minute candles follow these intervals:
- 9:15–9:20: The first 5-minute candle, which is complete.
- 9:20–9:25: The second 5-minute candle, which is still forming at 9:22.
At 9:22, the strategy therefore receives the candle covering 9:15 to 9:20 AM, even though more recent trading activity has already occurred.
On a price chart, this candle is typically labeled 9:15, referring to its opening time. In this documentation, we may also describe it as the candle ending at 9:20.
The candle ending at 9:25 will only become available to the strategy after it has fully completed.
This rule applies to all supported timeframes. Using a longer timeframe in a condition does not change how frequently the strategy itself runs; it only determines which completed candle data is available for that condition.
Estimated Prices and Actual Execution Prices
The separation between strategy evaluation and order execution has an important consequence: the price available when a strategy generates an order may differ from the price at which that order is executed.
Consider an account configuration where each entry is intended to use approximately ₹10,000 of capital.
Suppose the most recently completed candle has a closing price of ₹100.
The strategy may estimate the order quantity as:
₹10,000 ÷ ₹100 = 100 shares
However, the order can only execute from the next candle onward.
If the next candle opens at ₹102, a market order for 100 shares would require ₹10,200 before trading charges, rather than the originally estimated ₹10,000.
This difference matters because:
- The actual capital required may be different from the estimated amount.
- The account may have insufficient funds for an order that appeared affordable when it was generated.
- The actual entry price affects the resulting trade's profit, loss, and risk calculations.
This distinction is not limited to market orders. Limit orders can also execute at prices different from the latest known price, depending on their configured limit and subsequent market movement.
For details about quantity calculation, capital requirements, and account-specific sizing behavior, see Backtest Accounts.